| Sources- Based on internal SRJC documents ("Monitoring and Assessment of District Fiscal Condition", PowerPoint presentation, November 2014.
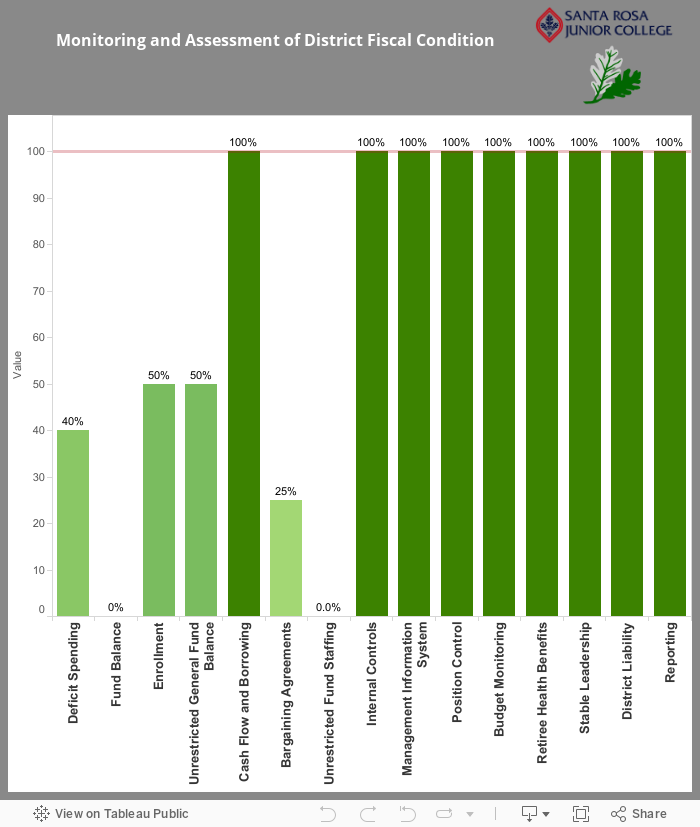
Notes- The visualization uses the "Sound Fiscal Management Self-Assessment Checklist (Dec. 2014)" data for 15 various areas. The completion rates are calculated by giving the "Yes" answers 100 score, "Yes/No" answers 50 score and "No" answers 0 score and by computing the arithmetical mean of these scores.
- The goals were established by the Strategic Planning Group. The goal completion level is indicated by oak leaves color as follows:
- needs work
- half done
- almost done
- completed
|